Participant report
A participant report contains information relevant to one specific participant, as opposed to a run report that contains an overall view of how successful a test run was. A specific participant report can be accessed by opening a run report and navigating to the "Participants" tab. Clicking on any participant's title in this view will direct you to the corresponding participant report. You may occasionally come across the participant report also referred to as a result report. Every single participant of a test run has their own participant report that you may analyze.
Participant report sections
The participant report consists of 6 tabs - Summary, Logs, Asserts, Artifacts, Machine statistics (only present for test runs executed in the "Performance test" mode), and WebRTC statistics. In addition to the 6 tabs, participant metadata is also available at the top of the participant report, regardless of the currently opened tab.
Participant metadata
The participant metadata is displayed at the top of the report in the form of a table and includes the following information:
- Participant result - the status of the participant.
- "Pass" indicates that the participant executed the script successfully and passed all asserts, if there were any.
- "Fail" indicates that the participant either failed in executing the script or failed at least one performance metric assert.
- "Timeout" indicates that the participant's test execution was cut short due to exceeding the participant timeout.
- "Aborted" indicates that the participant's test execution was cut short due to the test being aborted by the user.
- Selenium result - indicates whether the script execution was successful, including any functional asserts (e.g., whether an element is visible, whether an element contains a specific string oftext, etc.). Failed performance metric asserts do not affect the Selenium result status.
- Connection duration - how long the participant was actively executing the test.
- Connection start - the date and time at which the participant began to execute the test. The timestamp is presented using the timezone of the machine through which the report is being viewed.
- Browser, Location, Network, Audio, Video, and Compute units all reference the parameters that had been configured for the participant. Refer to the explanation on how Loadero participants are configured here for details on what these parameters mean.
- Audio MOS - a Mean Opinion Score calculated for the participant, using the e-model algorithm. If any of the metrics that the algorithm requires are missing, then this field will not be populated with a value. Refer to the Audio MOS section of the "Performance metric assertion" feature page for additional details on how MOS is calculated.
If Selenium result is "Fail", "Timeout", or "Aborted", then Participant result will have the same status. However, if the Selenium result is "Pass", then Participant result can still be either "Pass" or "Fail", depending on the status of executed performance metric assertions.
If the test run is aborted or times out, data such as taken screenshots or downloaded files could potentially get lost.
Summary
The summary tab contains up to two statistics tables.
The WebRTC statistics table is always present, though it will only be populated with data if the participant engaged in any WebRTC transmission (with the exception of incoming and outgoing "Connection count" - these will still be present with the value 0 if no WebRTC transmission happened). See this section for an explanation of the WebRTC metrics that are collected. Similarly to the run report this table also has a toggle to switch between audio and video metrics.
The Machine statistics table is present only if the test had been executed in "Performance test" mode.
These tables only contain data corresponding to the specific participant, unlike how they function in the run report.
In addition to the statistics tables, information about metrics generated by the "Time execution" command command are also available. However, another difference from the run report is that these metrics are not represented in the form of a table, but rather in the form of a Gantt chart, as shown in the image below.
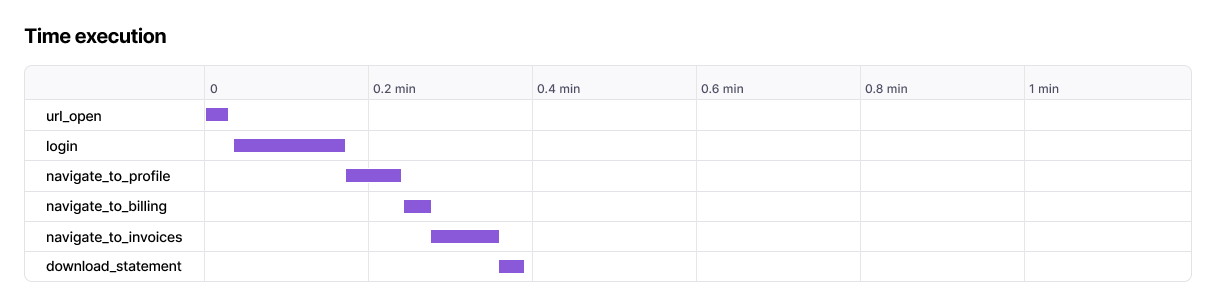
You can hover over any of the segments to see the exact timestamps and duration of that action.
If you would like to know more about what these metrics mean, you may refer to the following links for additional information:
Logs
The logs tab contains from 2 to 4 different logs, depending on the participant's browser and the test mode used.
The Selenium log describes the actions that the participant executed during
the test, in a format that depends on the scripting language used. This log is
useful for debugging script failures and confirming that the participant's
actions align with your expectations. If any commands that output to the console
are called in the script, such as console.log() or print(), they will be
output to the Selenium log as well. The Selenium log is always present in
any participant report.
If the test run was executed in "Load test" mode, the Selenium log may have reduced verbosity.
The WebRTC internals dump contains statistics about all WebRTC connections
made by the participant. The information in this file is structured similarly to
how it is recorded in the dump created by Chrome WebRTC internals, and it is
presented in JSON format (though if you download the file itself, it will be a
.txt file). The participant performs WebRTC measurements once per second and
these second-by-second measurements are recorded here. This log is useful for
in-depth analysis of metrics and how they change over the course of the test.
While the WebRTC internals dump contains data in a rather raw state, the log is
also used as the basis for calculating the metrics of the WebRTC statistics
table present in the "Summary" tab, as well as for generating the
graphs in the "WebRTC statistics" tab.
The Browser log contains all information that is output to the browser's
console. This, along with the Selenium log, can aid greatly in debugging why a
test may have failed, e.g., the system under test may log information on
internal server errors to the browser console. This log is present only if the
participant executed the test by using a Google Chrome browser. This log will be
absent for participants using Mozilla Firefox. Note that if any commands that
output to the console are explicitly called within the script, such as
console.log() or print(), they will be output to the Selenium log, not
the browser log.
If a participant is forcibly timed out by Loadero due to exceeding the allotted participant timeout, browser log collection will be skipped.
The Machine resource usage log contains data on client-side resource utilization. The participant measures CPU utilization, RAM usage, and network activity every second and these second-by-second measurements are recorded here. This log can be useful in tracking how a measurement changes over time, however, the machine resource usage log is also used as the basis for calculating the metrics of the machine statistics table present in the "Summary" tab, as well as for generating the graphs in the "Machine statistics" tab. You may find those graphs better suited for observing how a specific measurement changes over the course of the test.
If a participant's Selenium result has the "Fail" status, the Selenium log is the first place you should look for finding out what went wrong. Usually, the log will have some information on what kind of script execution error occurred and at which exact line of code in the script. The browser log and screenshots taken by the participant (if they were taken) are good secondary sources of information to provide more context to the failure.
Asserts
The asserts tab, similarly to how it works in the run report, lists all performance metric asserts that were executed by the participant, though the information on each assert differs from how it is represented in the run report.
Sometimes you may notice that a configured assert had not been executed by the participant and is not present on this page at all. This means that the assert was skipped. An assert is skipped if the metric was not recorded at all (e.g., an incoming video FPS assert where no WebRTC data was ever transmitted), or if the assert had a precondition and this precondition was not satisfied.
In the participant report each assert is described with the following information:
- Path, Operator, and Expected value refer to the specific assert that had been configured in the test.
- Actual value indicates what the actual metric measured by the participant was.
- Status indicates how the actual value compares to the expected value, by using the appropriate operator. The status can be either "Pass" or "Fail". "Pass" indicates an assert where the comparison between the two values goes as expected, whereas "Fail" indicates the opposite. While the asserts with "Skipped" status are shown in the run report, they are simply not shown at all in the participant report. Refer to the "Asserts" section of the "Run report" page for details on why asserts may be missing here.
If a participant has a Selenium result with the status "Pass", but the participant result has the status "Fail", the "Asserts" tab of the participant report is the first place you should look for an indication of what went wrong. It is very likely that one or more of the asserts failed.
Artifacts
The artifacts tab lists all artifacts that were generated by the participant. There are four types of artifacts that can be found in this tab - downloads, screenshots, video, and audio. Each type of artifact has its own section. A section will only be present, if there is at least one artifact of that section's type.
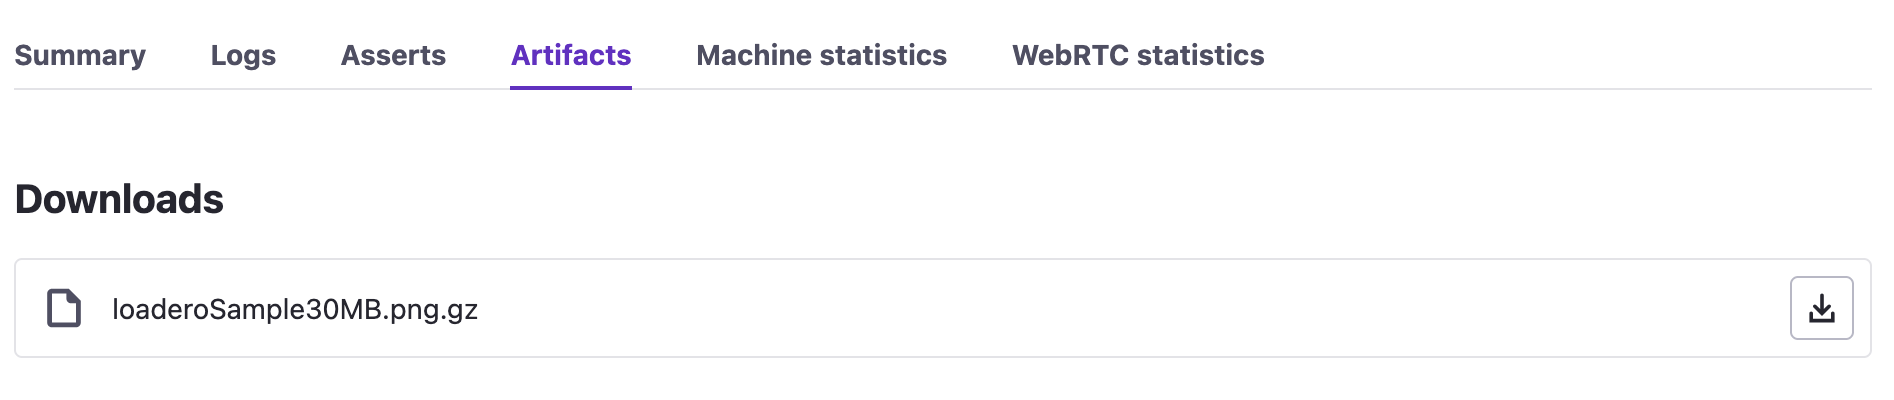
The Downloads section contains any files that were downloaded by the
participant during test execution. Each of these files will be served in the
"Artifacts" tab as a compressed .gz file. Refer to our page on
how to download files during the test
for additional details on how downloaded files are handled. Note that downloaded
files are saved here only if the test was executed in
"Performance test" mode.
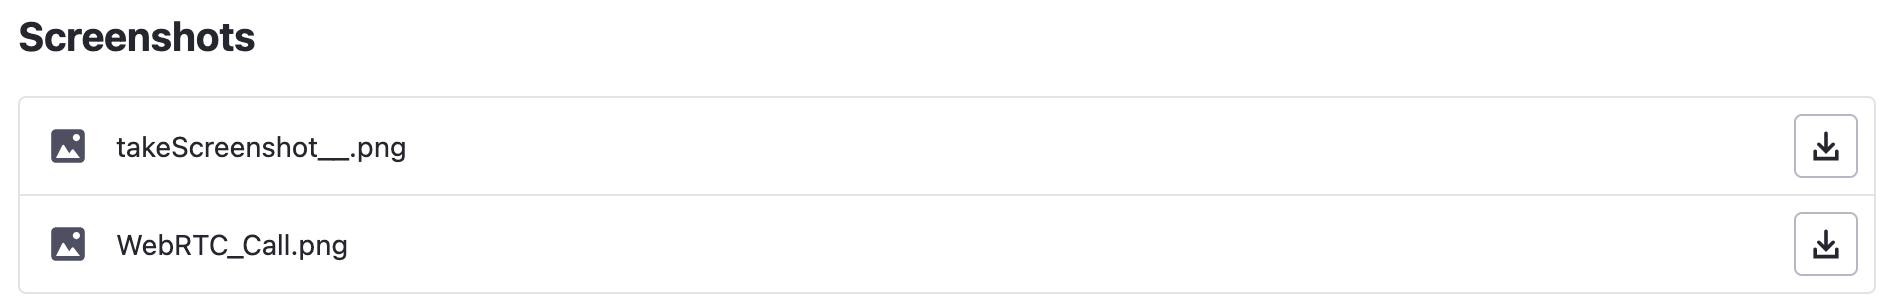
The Screenshots section contains all screenshots that were captured by the participant during the test. Primarily, screenshots will be taken due to instructing the test script to do so. Each of the supported frameworks has built-in functionality to capture a screenshot, refer to the documentation of your framework of choice. Make sure to provide a valid extension to the command you're using to take the screenshot, as if it is invalid, the screenshot will be served with an invalid extension as well.
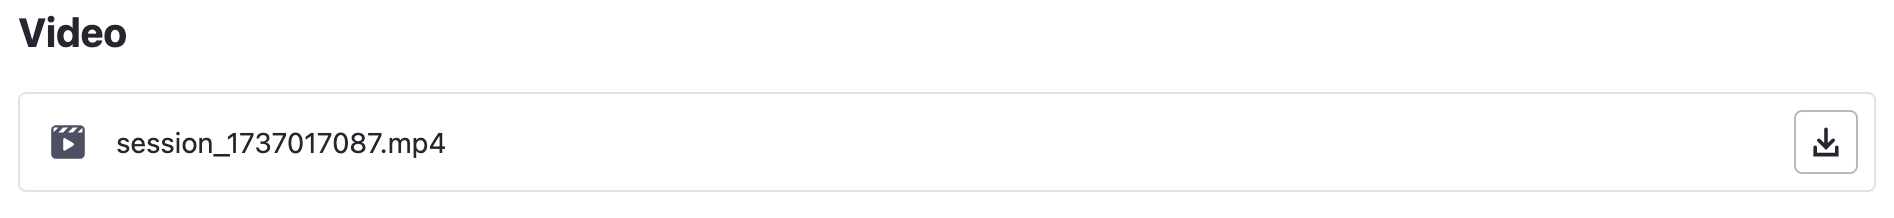
The Video section contains a video recording that displays everything the participant experienced during the test. This section will only ever contain one video file, and this file will only be present if the test run was executed in "Session recording" mode. Refer to our page on the session recording feature for more details on how generated video files are handled.
Lastly, the Audio section contains an audio recording of everything that happened during the test. Similarly to video artifacts, this section will only ever contain one file. Audio recordings will not be gathered for test runs executed in the "Session recording" mode, as the video recordings will fulfill the same function.
Participants must be explicitly configured to gather audio recordings. This configuration is not a publicly available feature and cannot be enabled by conventional means. For all intents and purposes, the feature of audio recordings can be considered as available only for specific Enterprise-level agreements.
Machine statistics
In the "Machine statistics" tab you can find graphs that depict how client-side performance measurements changed over time. These graphs are based on the data available in the machine resource usage log ("Logs" tab), just like the machine statistics table in the "Summary" tab. This tab is present only if the test was executed in "Performance test" mode.
A participant can have a varying amount of CPU cores allocated to them depending on their configured compute units. If the participant uses a G1 compute unit, then the CPU utilization will be capped at 50% (half a CPU core). A G2 compute unit would raise this cap to 100% (one full CPU core), a G4 compute unit - to 200% (two full CPU cores), and so forth.
CPU cores are not strictly dedicated to a participant - all participants that are on the same instance have access to all CPU cores on the instance. As such, a G2 compute unit participant may actually be using 4 different CPU cores, and their utilization adds up to a total of 100% CPU utilization. As a result, the amount of utilization may at moments exceed the permitted utilization cap (e.g., a spike of 104% CPU for a G2 participant), but Loadero will generally enforce the participant to bring the utilization back down soon after.
Lastly, client-side performance measurements are affected by more than just the browser instance of the participant, some processes on the instance itself outside the browser may contribute as well, though not significantly.
WebRTC statistics
This tab serves a similar purpose to the "Machine statistics" tab. However, this tab is always available, though it will not have any content if the participant did not engage in any WebRTC transmission.
In addition to graphs depicting how measurements change over time, each WebRTC connection is also described in detail.
All the information in this tab is based on the data available in the WebRTC internals dump ("Logs" tab), just like the WebRTC statistics table in the "Summary" tab.
Result expiration
Unless your project is set up with an "Enterprise" plan, all information in the Logs, Artifacts, Machine statistics, and WebRTC statistics tabs will expire eventually.
Each plan has its own result artifact retention period length. When this expiration takes place is dependent on this retention period length. Refer to the table below for how long this period is for each plan.
| Subscription plan | Result artifact retention period length |
|---|---|
| Trial | 14 days |
| Pay as you go: Essential | 30 days |
| Pay as you go: Ultimate | 90 days |
| Monthly | 60 days |
| Yearly | 60 days |
| Enterprise | Custom (incl. unlimited period length) |
For example, if you were to run a test using the "Monthly" plan, then all the information available in the previously mentioned four tabs will be accessible only for 60 days, after which it will expire. If you suspect you may need this information after expiration, we invite you to plan accordingly and download all the necessary data from the participant report before the expiration takes place - that way this information will be available on your machine for as long as you need it.
Expiration does not affect the data available in the Summary and Asserts tab. This information is permanently available.