Performance metric assertion
Loadero allows setting up assertions (also referred to as asserts) for metrics gathered during the test run. Asserts are automatically checked after the Selenium script execution concludes and the result will be reflected in the success status of the participants. If any of the set up asserts fails for a participant, then that participant's status will be set to "Fail" even if script execution itself was successful. Metric assertions can be configured during test creation or when editing the test by navigating to the "Asserts" tab, or via the API.
The header of any participant's report has two cells - "Participant result" and "Selenium result". If "Selenium result" is "Pass", but "Participant result" is "Fail", then it means that the participant failed because of an unsatisfied assert, but the script execution itself was successful.
Assert structure
This section details a full description of an assert's structure with the assumption that it is being set up via the test builder UI in the Loadero web application. Asserts can also be managed via the API.
Statistic types
Asserts are divided into four categories based on the metric type that they assert:
Measurements
After selecting the statistic type, the next step in assert creation is the
selection of the specific measurement that will be asserted. These will depend
on the statistic selected in the previous step. For example, the FPS (frames per
second) measurement will be classified under webrtc/video, bitrate - under
machine/network, etc. All available measurements that can be asserted for each
statistic are covered in the respective statistic's section.
Direction
Some measurements will ask to specify whether to assert incoming or outgoing metric values (toggling incoming by default). This is denoted by a toggleable switch with "In" and "Out" values.
The incoming direction refers to metrics regarding what the participant is receiving from other participants, e.g., what FPS the video stream of another participant is, how many bytes are being received from other participants, etc.
The outgoing direction refers to metrics regarding what the participant is sending to other participants, e.g., how many FPS the participant's own video stream has, how many bytes the participant itself is transmitting to others.
The direction component of an assert is specific only to machine network statistics and WebRTC statistics. Other statistics do not have an incoming/outgoing split.
It tends to be the case that your own video is clearer and more crisp than what the other person receives. As such, it is somewhat common for two identical participants in a test to have worse incoming metrics than outgoing metrics.
Metric aggregators
A metric can fluctuate a lot during the test and in order to assert the general behavior of a metric throughout the test (such as incoming FPS during a call that lasts an hour), it is necessary to summarize the metric values into a single number. This is achieved through the use of metric aggregators, which are listed in the table below.
The abbreviation column displays what the aggregator is called in the app.
| Aggregator | Abbreviation |
|---|---|
| 1st percentile | 1st |
| 5th percentile | 5th |
| 25th percentile | 25th |
| 50th percentile (median) | 50th |
| 75th percentile | 75th |
| 95th percentile | 95th |
| 99th percentile | 99th |
| average (arithmetic mean) | avg |
| minimum | min |
| maximum | max |
| sum | total |
| standard deviation | stddev |
| relative standard deviation | rstddev |
The aggregators listed are not available for every single available measurement.
For example, percentile metrics are not available for measurements like
machine/cpu/available because this measurement is static all throughout the
test and asserting a percentile for it would be pointless. For the same reason
some measurements do not have aggregators available at all.
Relative standard deviation gives more context by reflecting the offset keeping the scale of value. For example, if standard deviation is only 1 byte it does not give any indications about the significance of fluctuations. But by using relative standard deviation it would return fluctuation in percentage form relative to the average value, immediately giving perspective on the fluctuations without the need to check the average value.
An additional aggregator unique to packetsLost measurements is the percent of
lost packets relative to the total amount, abbreviated as percent during
assert creation. This aggregator will return a value between 0 and 100.
If packets are lost, then they are retried by WebRTC which can result in a smaller packet loss since the previously presumed-as-lost packets end up getting received after all. Packet loss can even be reported as negative because of these duplicated, retried packets (where both the original packet is received, as well as the duplicated one). This is a peculiarity of how WebRTC itself works and is not a bug. You can read more about it in the RTP standard, specifically the "cumulative number of packets lost" section.
Operators and the expected value
After selecting an aggregator (or sometimes after selecting a measurement, as some measurements won't have aggregators at all), you will be prompted to select an operator. The table below lists all the operators available and how to identify them while creating an assert in the app's test builder.
If you would like to manage asserts via the API, the notation for that is given in the API usage section.
| Operator | Symbol in the test builder |
|---|---|
| equal to | == |
| not equal to | != |
| less than | < |
| less than or equal to | <= |
| greater than | > |
| greater than or equal to | >= |
| regular expression | Regex |
The selected operator defines the nature of the comparison that will take place between the actual value that is measured during the test run and the value that was set up for comparison.
The final step in assert creation is defining exactly that value to compare
against. If an assert's expected value type does not match the type of the
actual measurement provided, then the assert will always be ignored after a
run's execution. Make sure to provide a numeric expected value if the metric
itself is numeric. For example, machine/cpu/used/max > ten would be skipped,
as the metric is numeric, but the provided value to compare against is a string.
When using the Regex operator, the assert will check whether the specified
metric matches the regular expression provided in the "Expected value" field.
Action statistics
Action statistics measure metrics such as duration for different actions
performed in the Selenium script. Such actions are defined within the Selenium
script. Currently there is only one action statistic available in Loadero -
timeExecution. This corresponds to
execution time measurements taken during the
test run.
The first thing that sets these actions/timeExecution statistics apart from
all others is the fact that instead of choosing one of several pre-defined
measurement types, you are instead prompted to input the name of the timecard. A
timecard is what is generated as a result of the Time Execution command, and the
name that needs to be provided in the assert corresponds to the name parameter
that had been provided to the command when calling it in the script.
For example, if you have called the command in the test script and provided the
name locate_search_bar like in the example shown below, then a timecard will
be generated linking the name to a duration. By creating an
actions/timeExecution/locate_search_bar assert, the timecard with that same
name will be identified and the duration will be fetched for comparison.
- JavaScript + Nightwatch.js
- Java + TestUI
- Python + Py-TestUI
client => {
    client
        .url("https://www.ecosia.org")
        .timeExecution("execute_search_query", () => {
            client
                .waitForElementVisible("[type=search]", 10 * 1000)
                .setValue("[type=search]", ["QA Processes", client.Keys.ENTER])
                .waitForElementVisible(
                    "[data-test-id='layout-content']",
                    10 * 1000
                )
        })
        .saveScreenshot("search_results.png")
}
public void testUIWithLoadero() {
    open("https://www.ecosia.org");

    timeExecution(
        "execute_search_query",
        () -> {
            E(byCssSelector("[type=search]"))
                .waitFor(10)
                .untilIsVisible()
                .sendKeys("QA Processes\n");
            E(byCssSelector("[data-test-id='layout-content']"))
                .waitFor(10)
                .untilIsVisible();
        }
    );

    E(byCssSelector("[data-test-id='layout-content']"))
        .saveScreenshot("search_results.png");
}
def test_on_loadero(driver: TestUIDriver):
    def execute_search_query():
        e(
            driver, "css", "[type=search]"
        ).wait_until_visible().send_keys(["QA Processes", Keys.ENTER])
        e(driver, "css", "[data-test-id='layout-content']").wait_until_visible()

    driver.navigate_to("https://ecosia.org")
    time_execution("execute_search_query", execute_search_query)
    driver.save_screenshot("search_results.png")
Another peculiarity with the actions/timeExecution statistics is that their
measurements are not aggregable. Even if you call the Time Execution command
with the same name multiple times, each one will generate a separate timecard
and each timecard will be asserted against. E.g., if you call the Time Execution
command with the name locate_search_bar five times, then each of those five
will be asserted. You cannot assert the average, maximum, etc. of all five
instances of this name.
If an assert is created for a timecard, but that timecard never gets generated during the test run, then the assert's result will be "Skipped". Skipped asserts do not contribute to the final decision of whether the participant has a PASS or FAIL status.
Machine statistics
Machine statistics measure metrics regarding the hardware that the participants
are executing the script on. There are three types of machine statistics that
are monitored by the participant - cpu, ram, and network. The machine
statistics of any participant can be found in its
participant report.
All of the machine statistic measurements that can be asserted are provided in
the table below. The machine prefix has been removed from the first column for
brevity, as it is there for every single machine statistic measurement.
Measurements marked as static have an unchanging value throughout the test.
Static machine statistic measurements have only one aggregator available -
total - which actually aggregates just that one single static value. E.g.,
cpu/available/total for a G4 participant will be 200%, because this
measurement is not actually monitored in time, but rather just measured once at
the beginning of the test, since the amount of available CPU does not change.
| Measurement | Unit | Description |
|---|---|---|
cpu/available | percentage | Static. Total CPU power available |
cpu/used | percentage | Total CPU power used |
cpu/percent | percentage | Total CPU power used relative to CPU power available |
ram/available | megabytes | Static. Total RAM available |
ram/used | megabytes | Total RAM used |
ram/percent | percentage | Total RAM used relative to RAM available |
network/bitrate | kilobits per second | Network bitrate |
network/bytes | kilobytes | Total amount of network traffic |
network/errors | count | Number of network errors |
network/packets | packets per second | Number of network packets |
network/packetsLost | count | Number of lost network packets |
Network metrics also have a further split into outgoing and incoming metrics. You can read about what this split means here.
The used measurements for CPU and RAM detail the absolute value, whereas
percent describes the usage relative to the amount that was actually
available. For example, if a participant is G4, its cpu/available/total will
be 200%. Let's say that the cpu/used/avg value is 175%. In this case
cpu/percent/avg will be 175 / 200, or 87.5% CPU usage out of the total CPU
that had been available.
The used measurement can exceed 100%, as it refers to the absolute utilization
of CPU cores - if there are two CPU cores available, then used can go up to
200%. On the other hand, the percent measurement will always be within the
range of 0-100%.
MOS (Mean Opinion Score) statistics
MOS (Mean Opinion Score) statistics measure the overall quality of audio or video during a test. This can be achieved through the use of various MOS calculation algorithms
Currently Loadero supports MOS calculation only for audio, so mos/audio is the
only MOS statistic type. The mos/audio statistic also has only one available
measurement type - e-model, as it is currently the only audio MOS calculation
algorithm available in Loadero.
E-model MOS is calculated at the end of the test from the averages of network
metrics that had been gathered throughout the whole test duration, meaning the
algorithm's score is a reflection of what the audio quality was on average. This
is why the only aggregator available for this measurement is avg.
WebRTC statistics
WebRTC statistics measure various aspects of audio and video streams during the test as denoted in the WebRTC protocol. A participant's WebRTC measurements can be viewed in its participant report.
There are two types of WebRTC statistics monitored by the participant - audio
and video. All of the WebRTC statistic measurements that can be asserted are
provided in the tables below. Multiple of the measurements are available for
both audio and video statistics, so the available measurements have been
separated into three tables:
- measurements available for both
audioandvideo - measurements available only for
audio - measurements available only for
video
WebRTC statistics usually have many tracks being sent and received at the same time. However, Loadero currently doesn’t assert each track individually, meaning you can’t check that the average value of each individual track meets a threshold, but rather that all tracks combined meet that threshold. Let’s look at an example. Assume that there are 2 tracks, both of which receive data for the same amount of time, but the first track receives 50kbps constantly, while the second track receives 150kbps constantly. Individually the average bitrates would be 50kbps and 150kbps respectively, however after combining the average bitrate will be reported as 100kbps.
The original WebRTC dump is available for download to perform customized assertions.
If an assert has been created for a measurement that never retrieved any metrics during the test, that assert will be set to the "Skipped" status and it will not have any impact on whether the participant gets a "Fail" or "Pass" status. Some reasons where such assert skipping may occur are:
- Mozilla Firefox simply does not provide metrics for some audio measurements.
- The test run never started a WebRTC call, so there are no metrics for WebRTC measurements.
Skipped asserts do not affect the final Pass/Fail result of the participant. It
is as if the assert was never created at all. If you would like to make sure
asserts fail if WebRTC connections failed to be established, make sure to set up
an assert for the connections measurement to be greater than 0.
Measurements for both audio and video
| Measurement | Unit | Description |
|---|---|---|
bitrate | kilobits per second | Actual bitrate of media |
bytes | kilobytes | Amount of data conveyed throughout the whole test |
codec | string value | Codec of the stream |
connections | count | Number of WebRTC connections established |
jitter | milliseconds | Duration of media jitter |
jitterBuffer | milliseconds | Size of jitter buffer |
packets | packets per second | Number of network packets |
packetsLost | count | Number of lost network packets |
rtt | milliseconds | Duration of round-trip time |
The bitrate measurement tracks how the metric changes every second. If you
would like to assert the total amount of data transmitted throughout the entire
test duration, a bytes/total assert is what you're looking for.
The following measurements are not aggregable:
codec- unchanging in time, as well as the fact it's a string valueconnections- measurement is not monitored in time, but rather the number you see is already the total amount of connections established throughout the test
Audio-specific measurements
| Measurement | Description |
|---|---|
level | Value in the range 0..1 (linear), where 1.0 represents 0 dBov, 0 represents silence, and 0.5 represents approximately 6 dBSPL change in the sound pressure level from 0 dBov. |
Video-specific measurements
| Measurement | Unit | Description |
|---|---|---|
fps | count per second | Number of frames encoded/decoded per second |
frameWidth | pixels | Frame width |
frameHeight | pixels | Frame height |
Conditional assert execution
It is possible to define conditions that must be met in order for an assert to be executed. If this condition is not met, then the assert will be skipped for the given participant. This is useful in situations where you want something to be asserted for one participant but not for another. This is achieved via preconditions.
When a participant finishes test execution, it will automatically go through all asserts and report on whether these asserts have passed or failed according to the metrics gathered throughout the test run. If a precondition is identified for the assert, then a check is performed for whether this precondition is met. If it is not met, then the assert is skipped.
One example use case is a test where you have both participants with default network settings and participants with impaired network conditions. The expected network bitrate threshold is likely to be different for each type of participant, and you can define these thresholds separately by creating two identical asserts, just with different expected values and different preconditions.
Preconditions can be managed for an assert while creating or editing an assert in the test builder. Preconditions consist of three parts: the property, operator, and value. Once a participant finishes execution and begins iterating over all asserts, it will check whether its properties match what is specified in the precondition. Examples:
- A participant using G4 compute units finishes test execution. While iterating
over asserts, a
machine/network/out/packetsLost/total == 0assert is found. This assert has the precondition "Compute units == G4". This participant's "Compute units" property really is equal to G4, therefore the precondition is met and the assert is executed. - The same participant using G4 compute units also finds another assert -
machine/network/out/packetsLost/percent < 5%. This assert has the precondition "Compute units == G1". This participant's "Compute units" property is not equal to G1, therefore the assert is skipped.
Skipped asserts do not contribute to the final decision of whether the participant has a PASS or FAIL status. It is as if the assert had never been set up at all.
Available properties
- Audio feed
- Browser
- Compute units
- Group name
- Group number
- Location
- Network
- Participant name
- Participant number
- Video feed
If setting up preconditions via the Loadero API, the syntax for some properties is very particular. In the list above most properties link to the specific page describing what these properties are. For the audio feed, compute units, location, network, and video feed properties refer to the "API identifier" column in the table of the linked page. For the browser property, refer to the "API usage" section of the "Browsers" page. The remaining properties are far more free-form.
When the test begins execution, each group is assigned a group number. For each
group defined for the test, a set of run groups will be created, as many as
the count parameter specifies. Each of these run groups has a group number
which indicates the order in which these run groups began execution.
For example, let's say a test has two groups A and B - A has count=4, and B
has count=2 and the test is set to use the
"Linear group" strategy. Group A will spawn four run
groups. The first run group will have the group number 0, the second - 1,
the third - 2, the fourth - 3. Group B will spawn two run groups. The first
run group will have the group number 4, the second - 5. If you were to
create a precondition Group number == 0 for an assert, then this assert would
be executed only for those participants who belonged to the first run group that
began execution.
Participant number logic differs slightly. While groups are numbered in the
order they began the test, participants are numbered in the order they began the
the test within their own group. E.g., if there are two groups, the first
participant of each group will have the participant number 0.
Precondition chaining
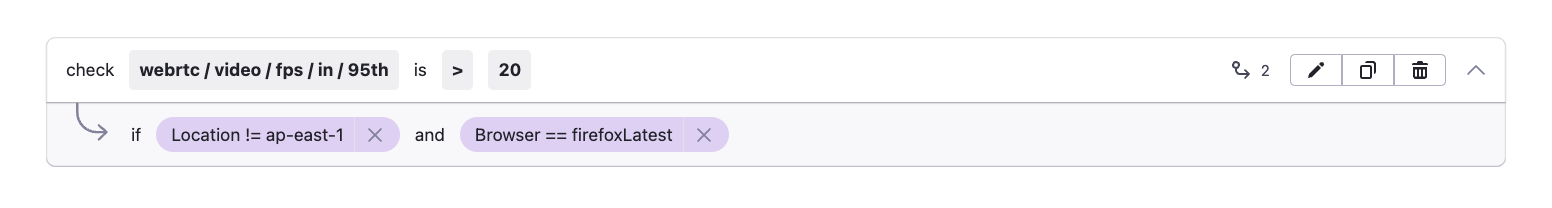
If multiple preconditions are set for a single assert, then they are chained using the logical AND operator. In other words, that assert will be executed only if all of its set preconditions were fulfilled. For example, if the assert should be executed only when the participant's location is not equal to "AP East - Hong Kong" AND when the browser is "Latest Mozilla Firefox", your assert would look like the image below.
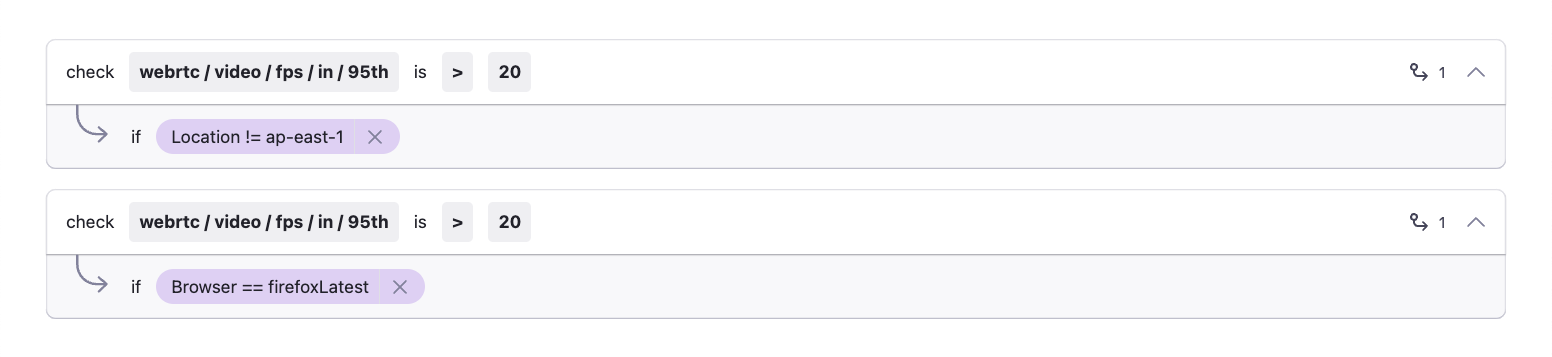
To implement chaining with the logical OR operator instead (execute the assert if AT LEAST one precondition is met), it is necessary to create duplicate asserts - one for each precondition. For example, if the assert should be executed only when the participant's location is not equal to "AP East - Hong Kong" OR the browser is "Latest Mozilla Firefox", you would have to create two asserts like the image below.
If a participant meets both preconditions, then each of the two asserts will be executed, regardless of the fact that they are both identical. Each of these asserts' result will be visible in the result report, despite that result being the same for all duplicates.
Pay attention when chaining multiple preconditions with the AND operator from the same property field, e.g., Browser. In many cases such preconditions can be contradicting.
For example, chaining two preconditions via the AND operator that the browser must be a version of Chrome and that the browser must be a version of Firefox will always result in a skipped assert.
API usage
When using the Loadero API to manage asserts, the assert is composed of the metric path, operator, and expected value. The operator and expected value fields mirror their field counterparts in test builder assert creation, however, the metric path is a composite string, consisting of the statistic, measurement, direction, and aggregator.
The operators are also defined differently when using the API, these definitions are provided in the table in this section.
Metric path
As mentioned above, the metric path consists of the statistic, measurement, direction, and aggregator. If one of these components does not exist for an assert (most commonly - direction, occasionally - aggregator), it is simply skipped in the metric path.
Metric path construction generally follows the template of
{statistic}/{measurement}/{direction}/{aggregator}. Below are listed some
examples of how a metric path is constructed.
- Statistic:
webrtc/audio - Measurement:
level - Direction:
in - Aggregator:
95th
These will form the metric path webrtc/audio/level/in/95th.
- Statistic:
machine/cpu - Measurement:
used - Direction: this statistic type does not have a direction component
- Aggregator:
max
These will form the metric path machine/cpu/used/max.
- Statistic:
actions/timeExecution - Measurement:
locate_search_bartimecard - Direction: this statistic type does not have a direction component
- Aggregator: this statistic type does not have an aggregator component
These will form the metric path actions/timeExecution/locate_search_bar.
Operators in the API
When defining an operator via the API, they should be referenced like in the table below. This is relevant both for the operator of an assert and the operator of a precondition.
| Operator | How it is defined in the API |
|---|---|
| equal to | eq |
| not equal to | neq |
| less than | lt |
| less than or equal to | lte |
| greater than | gt |
| greater than or equal to | gte |
| regular expression | regex |