Run report
The run report of an executed test run contains a lot of information, from general details like test duration and the reached peak load, to collated data like performance metric statistics and a report on success rate of each assert. Since different details are available in different parts of the report, this page's purpose is to guide you on what information can be found where.
While the run report focuses on a general view of the test and compiles all participants' results, specific details on each participant's test execution are available in their participant report.
The run report consists of 4 tabs - Summary, Participants, Asserts, and View script. Additionally, regardless of the currently selected tab, metadata about the test run is always visible at the top of the report.
Further headings detail what information is included in the run metadata, and what each of the 4 tabs contains.
Run metadata
The run metadata is displayed at the very top of the run report in the form of a table and includes the following information:
- Test name at the time of launching the test run.
- Test status ("Success" if all participants passed the test, "Fail" if at least one participant failed the test, "Aborted" if the test was aborted by the user).
- Success rate across all participants, depicted as a percentage.
- Test start - the date and time when the test run entered the "Running" phase. The timestamp is presented using the timezone of the machine through which the report is being viewed.
- Test end - the date and time when the test run finished execution as a whole. The timestamp is presented using the timezone of the machine through which the report is being viewed.
- Test duration - the amount of time that passed between the moment of the first participant beginning test execution and the moment of the final participant finishing test execution.
- Participants - the total amount of participants that were set up for the test.
Summary
The "Summary" tab is automatically opened whenever you open a run report. The following headings describe each section of this view.
Active participants graph
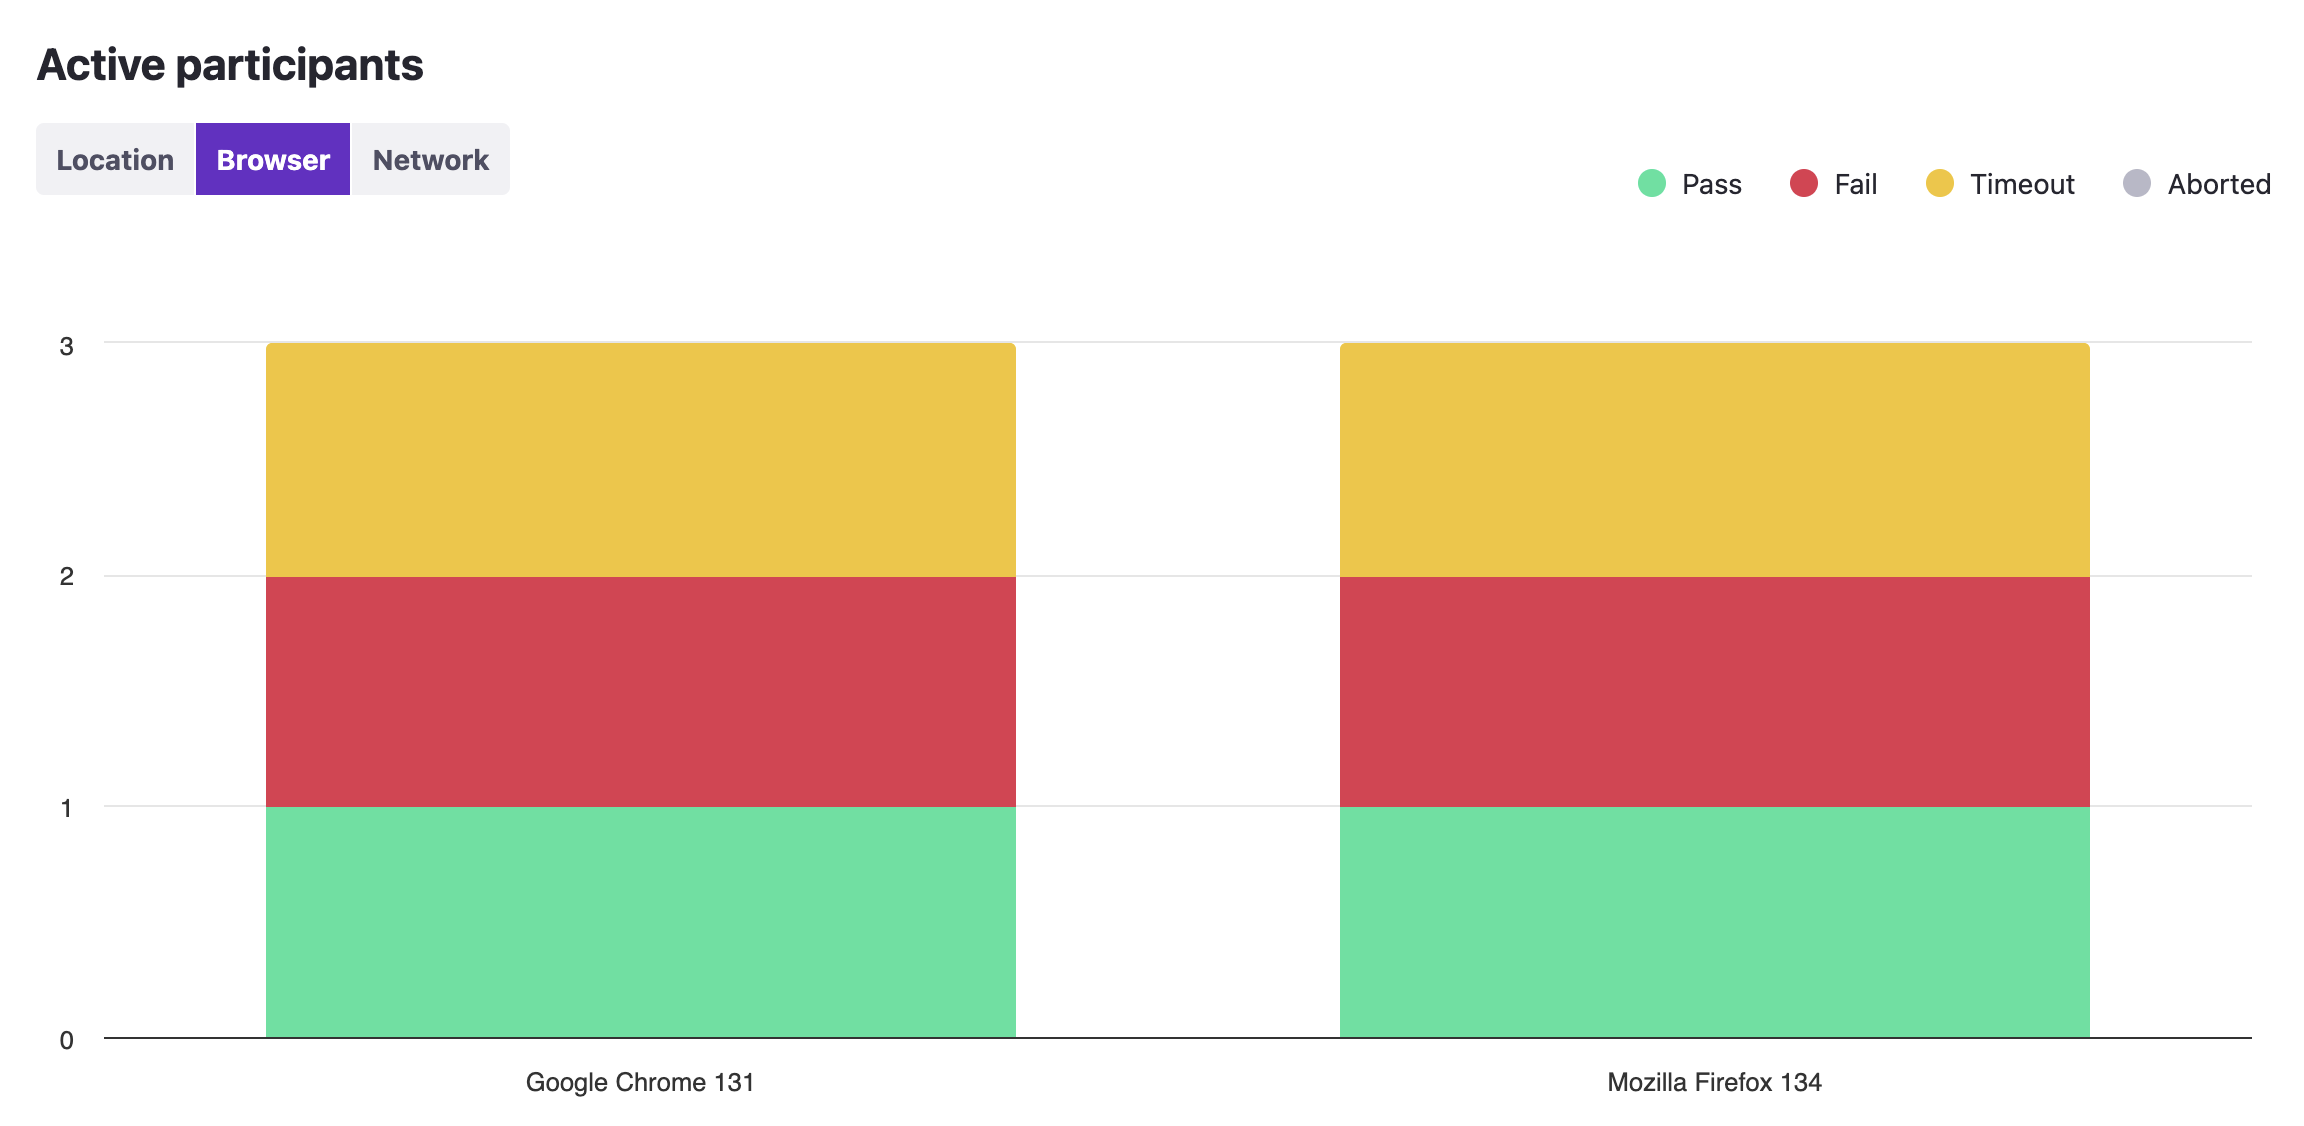
This graph depicts all the participants that executed the given test. The primary purpose of this graph is to display the status distribution across all participants - how many passed, how many failed, how many timed out, and how many were aborted mid-execution.
The graph also allows to see how the participants were split across locations, browser versions, or configured network conditions. This helps in detecting patterns in specific configuration settings causing failures. For example, participants based in Oregon pass, but participants based in Frankfurt fail because of an unexpected "Accept cookies" pop-up that did not show up for US participants.
The example below depicts a test where 3 participants executed the test via Google Chrome 131, and 3 participants executed it via Mozilla Firefox 134. For both browser versions one participant passed, one failed and one timed out.
The "Network" categorization takes into account only what the participant's "Network conditions" value was set to in the test configuration. If the value is dynamically updated mid-test, it will not be reflected in this graph.
Load graph
The load graph displays a timeline of how many participants were executing the test at any point in time. Note that the time at which a participant begins executing the test is not the same as the time at which a participant navigates to the URL specified in the script. As such the load graph isn't an entirely accurate representation of how many participants were active on the system under test, however, it is a close approximation.
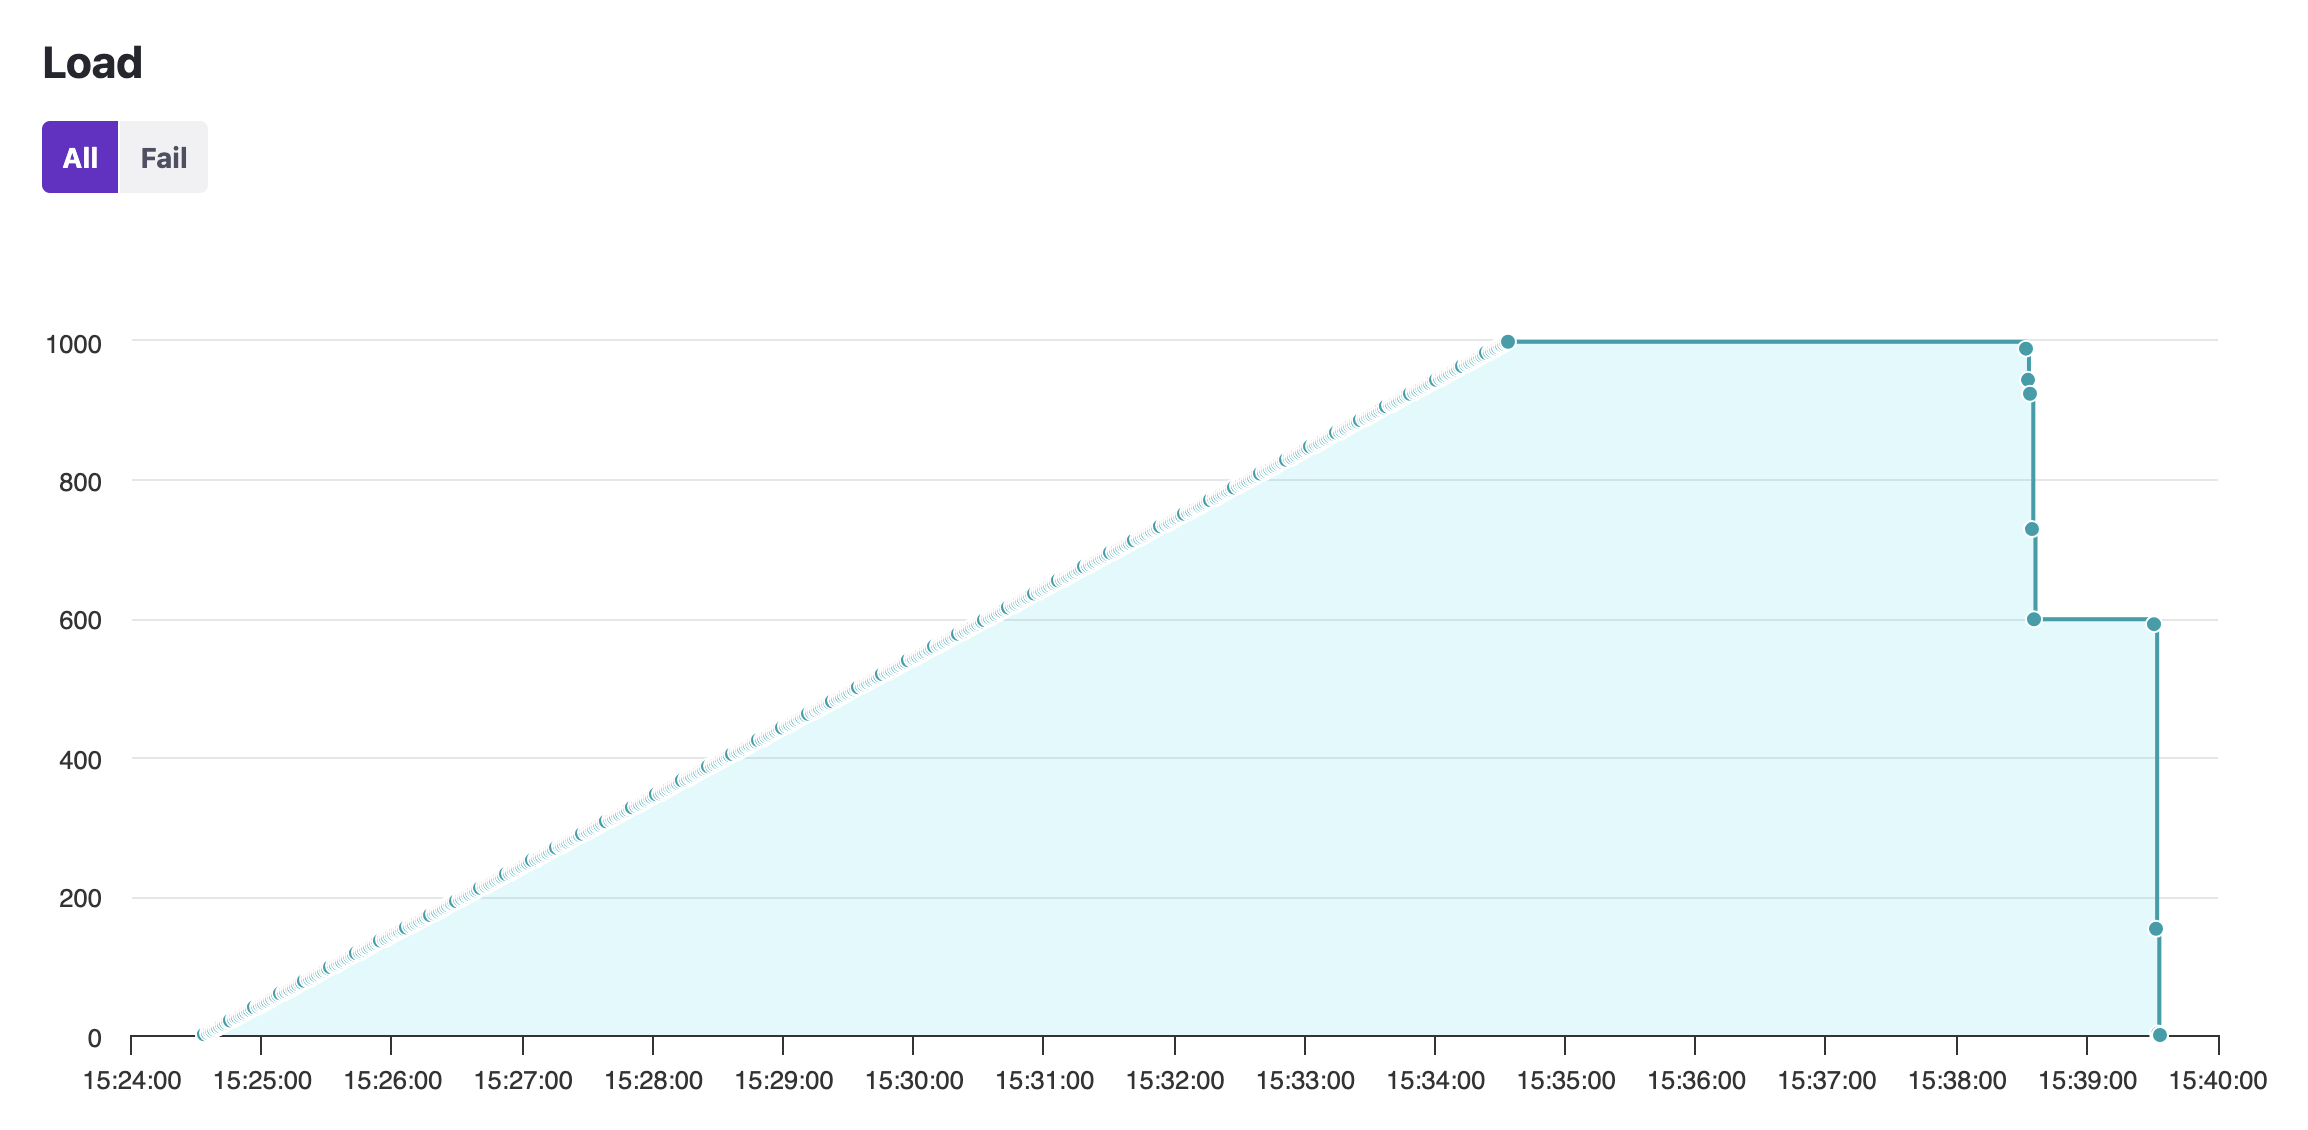
The graph also provides a "Fail" toggle that has the timeline display the pattern and timing of failed participants.
Run statistics
At the bottom of the "Summary" tab you can find up to three statistics tables. The WebRTC statistics table is always present, but will be populated with data if there was any actual WebRTC transmission happening in the test run itself. This table contains WebRTC metrics that define the audio and video quality. A toggle switch at the top of the table allows switching between viewing audio metrics and video metrics.
The machine statistics table is only present if the test run was executed in "Performance test" mode. This table is populated with metrics that describe client-side performance, such as CPU utilization, RAM usage, incoming and outgoing network activity. Keep in mind that these are client-side metrics, they are not the metrics of the system under test.
The "Time execution" table is only present if the "Time execution" command had been executed at least once within the script. This table contains information on the timecards that had been generated.
If you would like to know more about what these metrics mean, you may refer to the following links for additional information:
At the top of all these tables is also a bunch of toggle buttons that you can use to switch between what aggregate to calculate for the metrics. By default, the averages of statistics are displayed.
Note that the statistics tables represent values across all instances of that metric across all participants in the test. This means that, for example, an average metric for CPU usage indicates what that value was on average for all participants. If one or more participants for some reason have abnormally high or abnormally low values, you may notice a skew in the run statistics.
To view metrics only one a single participant level, refer to the participant report instead.
Participants
The "Participants" tab displays a list of all participants that were executing the test. The following information is given about each participant:
- ID: denotes the order in which participants finished test execution, e.g., an ID of 1 means that the participant was the first in the test run to finish the test.
- Title: the name of the participant, as well as the name of the group they were in, if they were in a group. E.g., a title of "Host (Call)" means that the participant's name was "Host" and they were in a group named "Call".
- CU, Browser, Location, Network, Audio feed, and Video feed all point to the participant's configuration parameters. For an explanation of these parameters, see this explanation on how Loadero participants are configured.
- Status: indicates whether the specific participant passed or failed the test.
Clicking the title of a participant will lead you to the corresponding participant report.
Asserts
The "Asserts" tab contains a list of all performance metric asserts that were executed at the end of the test. The information given here is aggregated across all participants of the test run and focuses only on whether the asserts passed or not. You should refer to the participant report of any given participant to see in more detail why an assert did or did not pass, such as what the exact value of the metric was. Within the run report, the following information is given about each assert:
- Path, Operator, and Expected all reference the assert as it had been configured within the "Asserts" tab of test builder. See our page on how to set up performance metric assertions for in-depth information about assert configuration.
- Preconditions: a list of preconditions that had been configured for the assert in the test, if there were any.
- Success ratio: specifies how many participants passed the assert of all participants that executed it.
- Status: depicts how the assert was evaluated across the whole test in
general.
- If all participants passed this assert, then the assert will have the status "Pass".
- If at least one participant failed this assert, then the assert will have the status "Fail".
- If all participants did not execute the assert at all, then the assert will have the status "Skipped".
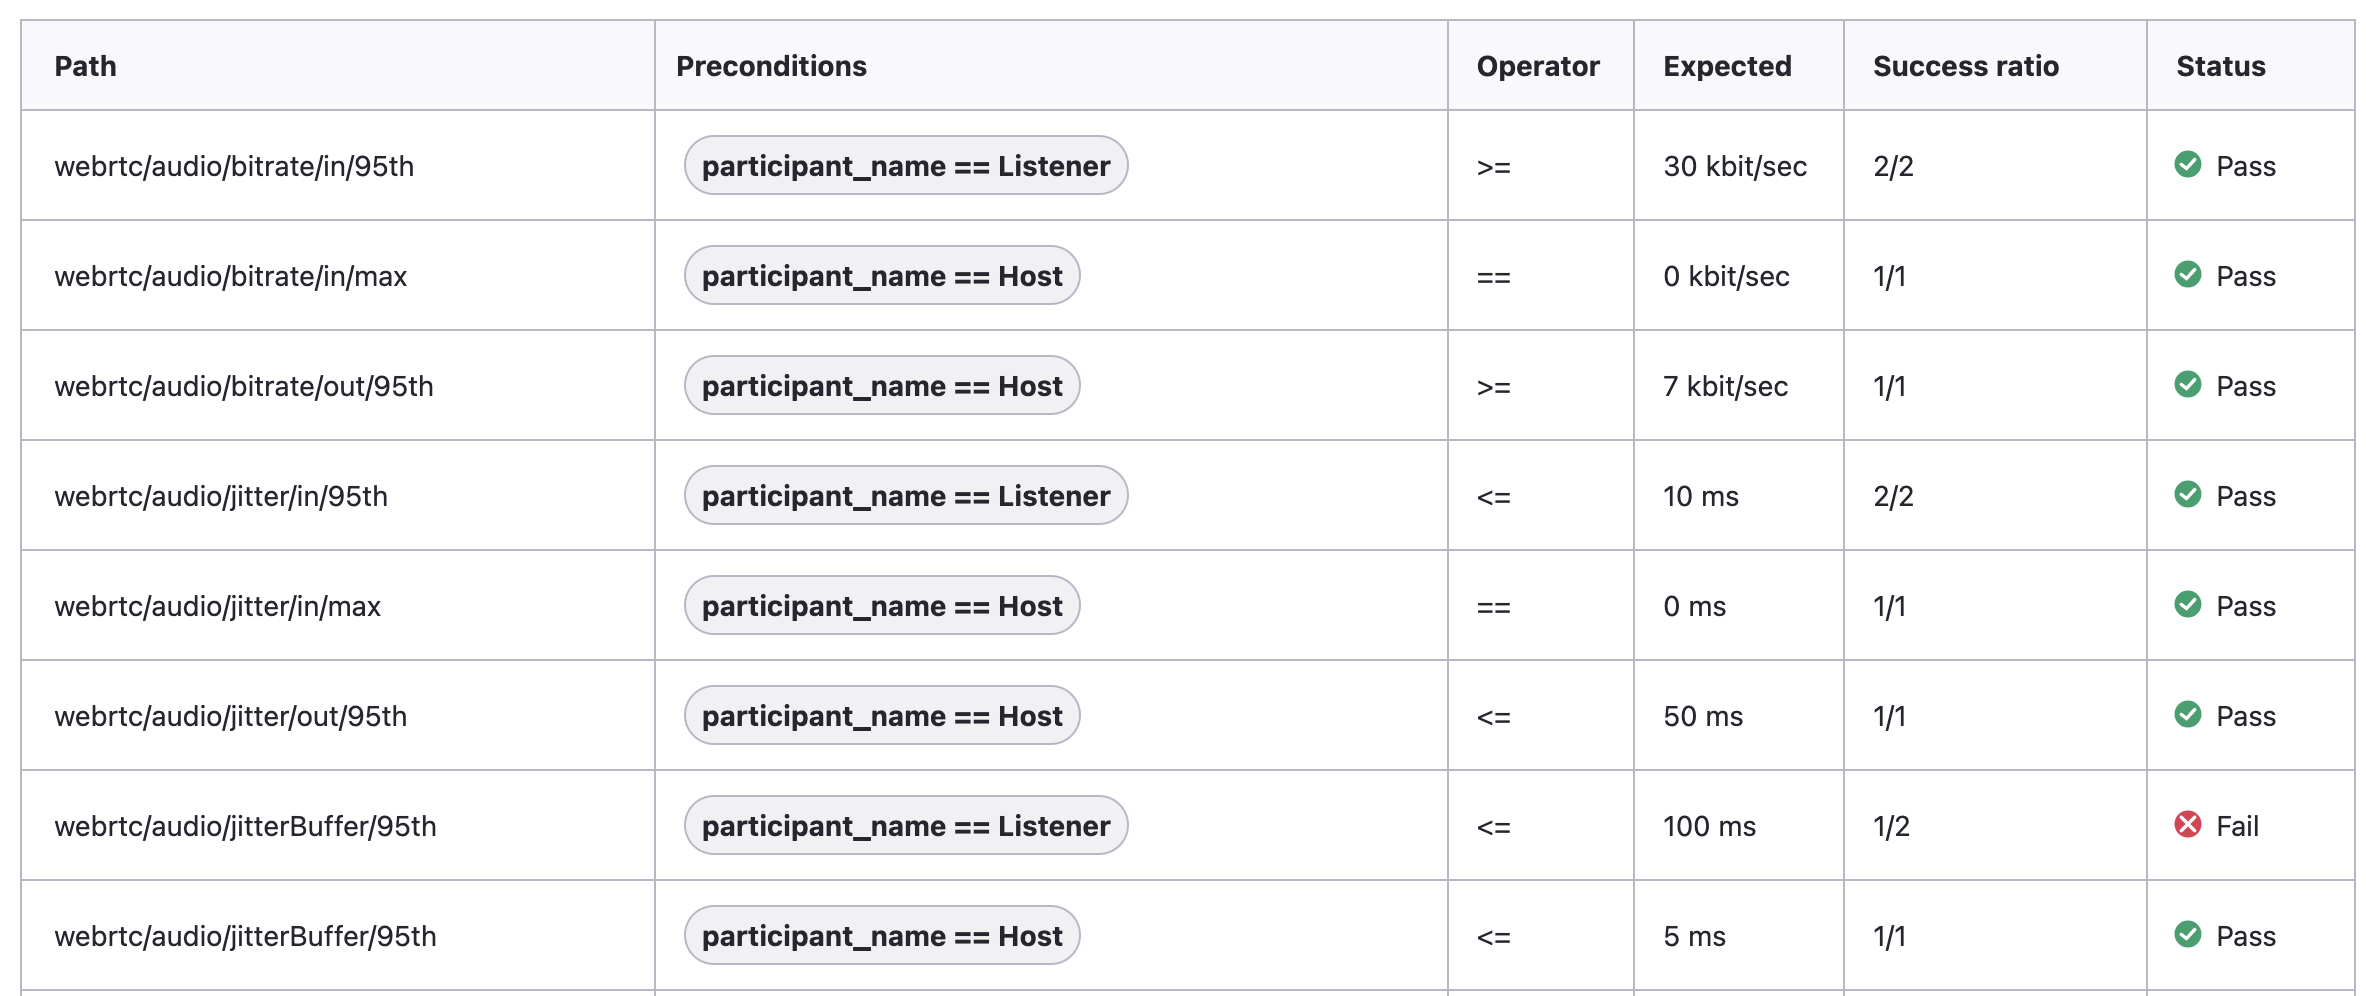
The image below shows the asserts list of a test run where asserts were split between the preconditions of either having the name "Listener" or the name "Host". The test had two listeners and one host, which is why the success ratio varies between 2/2 and 1/1. One assert has the status "Fail", because of the two participants that executed the assert, at least one failed it.
An assert may have the status "Skipped" if it was not executed by any of the participants in the test. Usually this happens due to one of two reasons:
- None of the participants met the set of preconditions that had been set up for the assert.
- The metric itself was not measured at all throughout the test, for example, a WebRTC assert will be skipped if the test never established a WebRTC connection, a machine assert will be skipped if the test was not executed in "Performance test" mode, etc.
View script
The "View script" tab displays the script that was being executed by participants during the test run. This can be helpful if a script is constantly being changed between test runs, as the script here will be displayed the way it was during the test run. Any updates made to the test's script after the test run has been launched will not be propagated to the run report's "View script" tab.
The script is formatted and color coded according to the currently selected framework and language for the project, not what the selection was at the time of launching the test run. If you launch a test using JavaScript + Nightwatch.js, and then change the project language to Java + TestUI, then the contents of the "View script" tab may seem odd, as JavaScript code will be formatted as if it were Java code.